Jaymaster Tree Clinicl uses PiCUS sonic tomography sound waves to investigate the internal conditions of trees.
A series of nails are placed around the tree in the measurement plane where we have identified the weaknesses that require further testing of the visual inspection and this is the measurement point and is used to send or receive sound waves.
The distance between measurement points is carefully measured and recorded by the field technician.
A sound wave is created by a hammer tapping one of its fingernails.
The PiCUS equipment measures the flight time of the sound waves between the transmitting point and the other receiver.
The software draws a "speed" or "density" map of the tree by calculating the apparent sound velocity (distance / time) and combining the measured tree structure with the acoustic data recorded during the assessment.
The speed of sound is related to the density of the tree and therefore to the density of the tree.
With the electronic hammer, we can record a full resolution tomographic image of fewer resolutions with 6 to 8 sonic sensors.
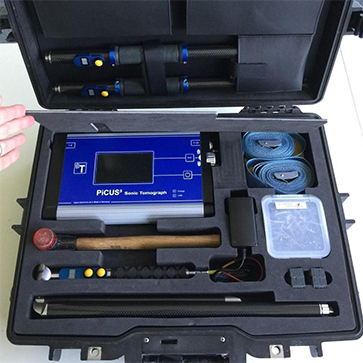
PiCUS Tomography
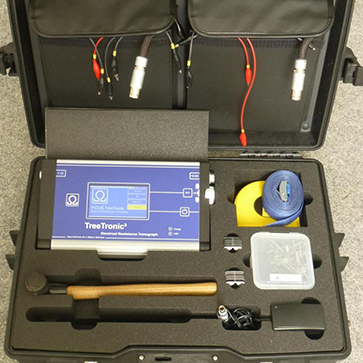
PiCUS Treetronic3
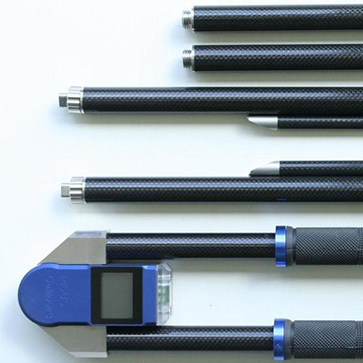
Sonic data recording
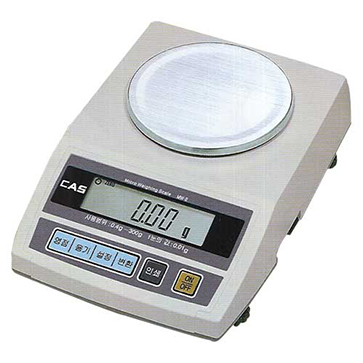
CAS Micro Weighing
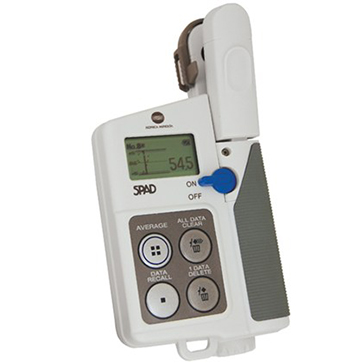
Konica Minolta SPAD 502 Plus Chlorophyll Meter
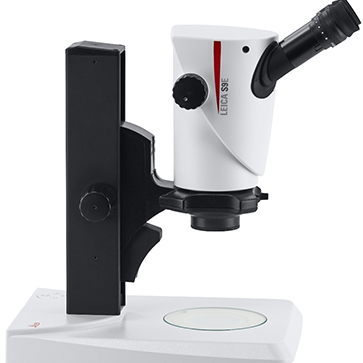
Dissecting microscope - LEICA S9I
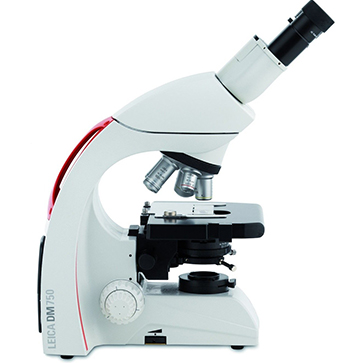
Uplight Microscope - LEICA DM750
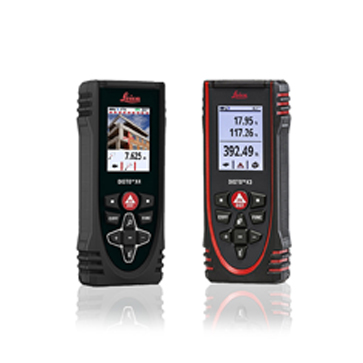
LEICA laser distance measurement
Tomography
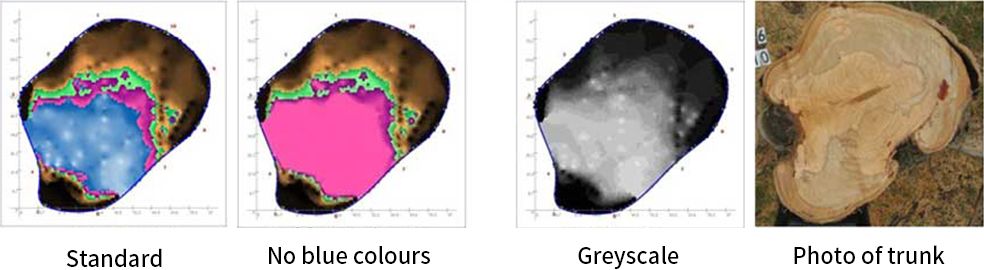
Powerful software compares all recorded velocities at one measurement level and shows where the sound waves travel slower than in the "fastest" region. There are three main color groups to be careful in analyzing tomographic images.
· Brown color (light brown to dark brown), green color, violet-blue-white color.
· brown shade indicates dark wood and green area indicates early rot.
· Purple is a decayed tree, and a blue color indicates hard cracks, cracks, and that wood are too small to transmit sound waves.
Images collected with tomograms can be used to identify critical areas for further testing.
The purple-blue-during-gamut area can only be displayed in purple color.
The example above shows a tomographic image of standard, violet (no blue), and gray color.
* These color definitions are part of the PiCUS expert software.